Our Pledge is in our Name…
Since its inception Ecological Fibers has placed environmental stewardship at the forefront of our business practices. Never driven by regulations or trends, we have always tackled our impact on our environment head-on by committing to improving our production methods not because we were asked to, but because it was simply the right thing to do.
Ecological Fibers’ history speaks for itself, producing the first water-based, solvent-free coatings in the business (now the industry standard), removing harmful chemicals and metals from our coatings before regulations asked us to, and in 2020 became the first producer of organic, plastic-free coatings.
Even though Ecological Fibers’ emissions are less than 3% of the industry average, we are now pledging to reduce it even more by incorporating new policies including updates to our company vehicles, updated water filtration, and utilizing more sustainable electrical sources.
To learn more about environmental initiatives and policies, visit our eco-green page.

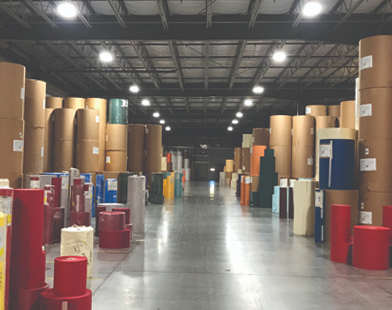
Our warehouses uses motion-activated LED lights that use a fraction of the energy of standard lighting options.
SCOPE 1 REPORT:
Total Direct Green House Emissions for 2024: 2716.954 MT (CO2e)**
SCOPE 2 REPORT:
Total Indirect Green House Emissions for 2024: 511.92 MT (CO2e)**
Carbon Dioxide Emissions
Ecological Fibers (2024): 2,714.33 MT (CO2e)
Industry Average* (2021): 89,783.14 MT (CO2e)
Methane Emissions
Ecological Fibers (2024): 1.042 MT (CO2e)
Industry Average* (2021): 262.18 MT (CO2e)
Nitrous Oxide Emissions
Ecological Fibers (2024): 1.584MT (CO2e)
Industry Average* (2021): 1,046.91 MT (CO2e)
Above units measured in Metric Tons CO2 Equivilent. *Industry Averages were collected and calculated from EPA “2020 Total Reported Direct Emissions from Pulp and Paper, by Subsector (as of 8/12/2022)”. † Type of emissions: natural gas, refrigerants, fire suppression, gasoline, and diesel.
TOTAL GREEN HOUSE EMISSIONS FOR 2024:
Ecological Fibers emitted 2716.946 Metric Tons of CO2 in 2024. The industry average in 2022 was 91,353.51 Metric Tons. These numbers confirm that Ecological Fibers’ operates using 97.02% fewer emissions than our industry average.
Understanding the numbers…
The data collected for our GHG emissions include electricity, gas, and other fuels for facility use or transportation of supplies and employees. The quantification of our GHG emissions consists of the data collection process and the application of documented emission factors from the EPA Greenhouse Gas Inventory Guidance forms. This quantification comprises two different methods.
-
Direct emission sources in which combustion of fuels occurs and indirect emissions from consumed electricity: Emissions of CO2 (t CO2e) = Mass/Volume of Fuel X Emission Factor.
-
Direct emission sources where no combustion of fuel occurs (fugitive emissions) or if the results in GHG emissions are different than CO2 are converted to metric tons of CO2e (Carbon Dioxide Equivalent) using the Global Warming Potential (GWP) values provided by the EPA: Emissions of CO2 (t CO2e) = Mass/Volume of Fuel x Emission Factor
